
"What will the reservoir storage be in the next few weeks?" is the only question that matters
"This forecast is 85 percent accurate" means nothing on its own. What will the reservoir storage be in the next few weeks? What should we be prepared for? Whether a forecast is useful depends on how much the truth deviates from what would have happened anyway.
The cheapest forecast available for any reservoir is to look up what the lake usually did on this date, and over the weeks that followed, in other years. Call it the seasonal average. It needs no model, and it is harder to beat than most people expect.
Any real forecast has to be tested against that baseline. Compare a forecast to an easy guess, and it looks impressive. Compare it to historical averages, and the improvement looks much smaller. But that smaller number is the one worth having, because it tells you whether the forecast actually added any real value.
Water agencies have started asking for that number. They have not agreed on what to measure against, so the numbers coming back cannot be compared with each other.
A forecast built from history was useful for about a month, and mostly in summer
LYNXCE tested the question on Detroit Lake in Oregon, a federal dam on the North Santiam River where every measurement is public and anyone can check the work.
It was useful for about a month. Out to roughly 30 days it clearly beat the seasonal average. Past about 36 days it stopped beating it at all. A month of warning is useful for planning a drawdown or a withdrawal, and a good deal less than most people assume a reservoir forecast gives them.
It only really worked in one season. A forecast made in June still beat the seasonal average two months out. One made in December was behind after ten days. Summer at Detroit is a scheduled drawdown from a full lake, so history is a decent guide. Winter depends on which Pacific storms arrive, and history has little to say about that. A single year-round accuracy figure averages the two and describes neither.
Three things turned out backwards
Narrowing the forecast to similar years made it worse. Looking only at past years with a similar drought status sounds careful. It also throws away most of the history the forecast is built from, and at Detroit it cost more than it bought at every timescale tested.
A longer record produced a wider range, not a narrower one. Give the method sixteen years of history and it produces a tight, confident-looking range. Give it fifty-two and the range widens, because the longer record holds extremes the short one never saw. Nothing about the lake changed. A narrow range is usually a short record, so the useful question is how many past years went into it. Two or three is a story, not a statistic.
The uncertainty range was labelled as a percentile interval. A range described as covering the middle half of likely outcomes might lead a reader to expect reality outside it about half the time. At Detroit it landed outside about one time in six. The forecast was doing its job; the label was just implying the magnitude of historical outcomes.
Five questions to ask before acting on a reservoir forecast
- What was it beaten against? If nobody says, treat the accuracy figure as missing. It cannot be checked or compared with anyone else's.
- How was it tested? A forecast tested on the same years it learned from will always look good. The test has to hold back the year being predicted.
- Does it work in this season? Ask for the seasonal breakdown. It and the annual average can point opposite ways.
- Was each assumption checked, or just assumed? Sensible-sounding refinements sometimes make a forecast worse.
- How many past years is each number built on? A range computed from two years is an interpolation wearing the costume of a statistic.
Verification became an expectation before it became a standard
The World Meteorological Organization issued dedicated guidance on the subject in 2025, Guidelines on the Verification of Hydrological Forecasts (WMO-No. 1364), naming accuracy, bias, reliability, resolution and sharpness as the properties a forecast system should report. The Bureau of Reclamation's Snow Water Supply Forecasting Program asks applicants to show what their work buys against status quo snow monitoring. Forecast-Informed Reservoir Operations (FIRO) has grown from one pilot at Lake Mendocino into the screening framework Forbis and Ly (2025) describe the Corps developing from its California dams, and every viability assessment has had to show the forecasts are good enough to run a dam on.
So the demand for evidence is real. Against what?
Practical answers are already in use. Prado Dam's viability assessment used Critical Success Index for precipitation and Brier skill scores against climatology for inflow. Modi et al. (2025) used normalized mean quantile loss to connect skill to economic value across the western United States. Li et al. (2026) used ROC and correlation for terrestrial water storage. Each choice is defensible on its own. None of them can be set beside another.
Pappenberger et al. (2015) put the problem plainly: skill has no meaning in the absolute, and the reference changes the answer. The scoring rule is not at fault; a continuous ranked probability score decomposes the way Hersbach (2000) set out, but a skill score built on one is only ever a ratio against whatever reference gets chosen. Harrigan et al. (2018) showed what a study built that way looks like, across 314 UK catchments and a 50-year hindcast, and it is also where the honest magnitudes are: CRPSS of 0.75 at one day, 0.20 at one month, 0.11 at three. Arnal et al. (2024) and Baker et al. (2022) followed the design into FROSTBYTE and the Colorado, and the UK Centre for Ecology and Hydrology's Historic Weather Analogues method, in Chan et al. (2026), beats climatology by 0.13 in winter and 0.03 in summer over three-month outlooks. Modest, and strongly seasonal.
LYNXCE's position: reservoir forecasts do get verified in 2026, just against nothing in common. Two skill numbers from two studies cannot be compared, and a number quoted without its reference cannot be checked at all. Treat it as missing.
A 52-year hindcast at one public reservoir shows what the answer looks like
USGS, USACE and the US Drought Monitor publish everything the test needed. The method is an analogue technique in the Ensemble Streamflow Prediction line Day (1985) introduced: take the historical record of net inflow, line up the windows that start on the same day of the year, and read the spread. Keeping each window contiguous makes it a moving-block bootstrap, which is Künsch (1989), and Vogel and Shallcross (1996) tested that bootstrap against parametric alternatives for estimating reservoir storage. The bootstrap won.
The benchmark was settled before the run: day-of-year climatology of observed pool storage, leave-one-year-out, blind to the initial state. Detroit runs to a rule curve, so that benchmark is sharper here than at most sites. The expected answer went into the code before any number came out of it, at roughly 0.20 at 30 days, following Harrigan.
| Lead time | 10 d | 20 d | 30 d | 40 d | 50 d | 60 d |
|---|---|---|---|---|---|---|
| CRPSS vs. day-of-year climatology | +0.45 | +0.22 | +0.07 | −0.04 | −0.12 | −0.17 |
That is 18,801 forecasts at the 10-day horizon, scored on storage in acre-feet. Skill crosses zero at about 36 days. Persistence, scored the same way, ran from −0.07 to −3.61, so this is a hard reference.
The single row hides two reservoirs.
| CRPSS vs. day-of-year climatology, by season of forecast start | 10 d | 30 d | 60 d |
|---|---|---|---|
| Summer (JJA) | +0.89 | +0.72 | +0.46 |
| Autumn (SON) | +0.43 | −0.10 | −0.43 |
| Spring (MAM) | +0.54 | +0.05 | −0.37 |
| Winter (DJF) | −0.02 | −0.37 | −0.41 |
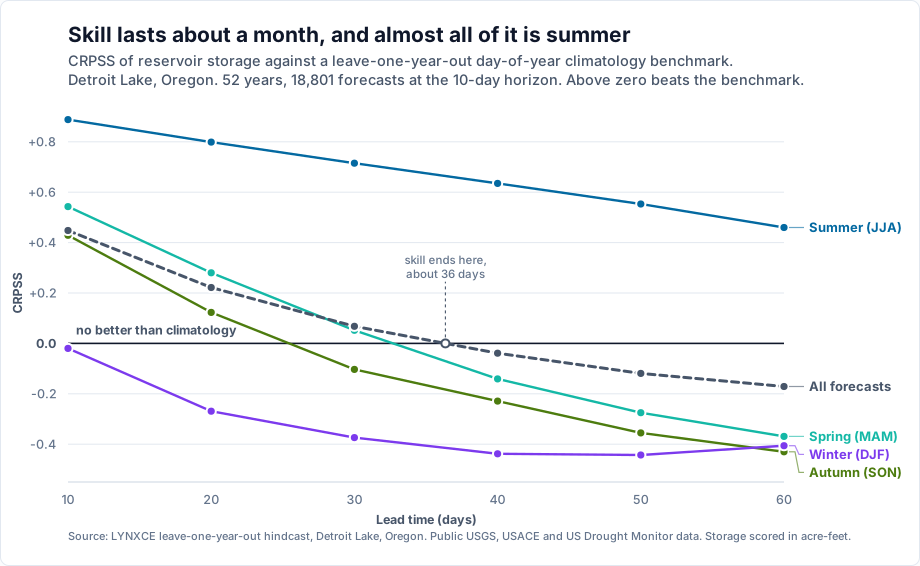
A forecast issued in June still beats climatology at 60 days. One issued in December has already lost at 10 days. Read operationally, this is a summer tool with some useful short-lead skill in autumn and nothing through the wet season.
One reservoir is one reservoir, though. Harrigan used 314, and nothing in these tables licenses a claim about how the method behaves anywhere else.
Conditioning on drought and shortening the record both cost more than they bought
The method filters its analogue sample by US Drought Monitor category. That filter is the only piece of explicit hydrological judgement in the whole thing.
| Horizon | 10 d | 20 d | 30 d | 40 d | 50 d | 60 d |
|---|---|---|---|---|---|---|
| Change in CRPSS from drought conditioning | −0.021 | −0.029 | −0.035 | −0.030 | −0.021 | −0.014 |
It costs skill at every horizon, taking roughly a third of what is left at 30 days.
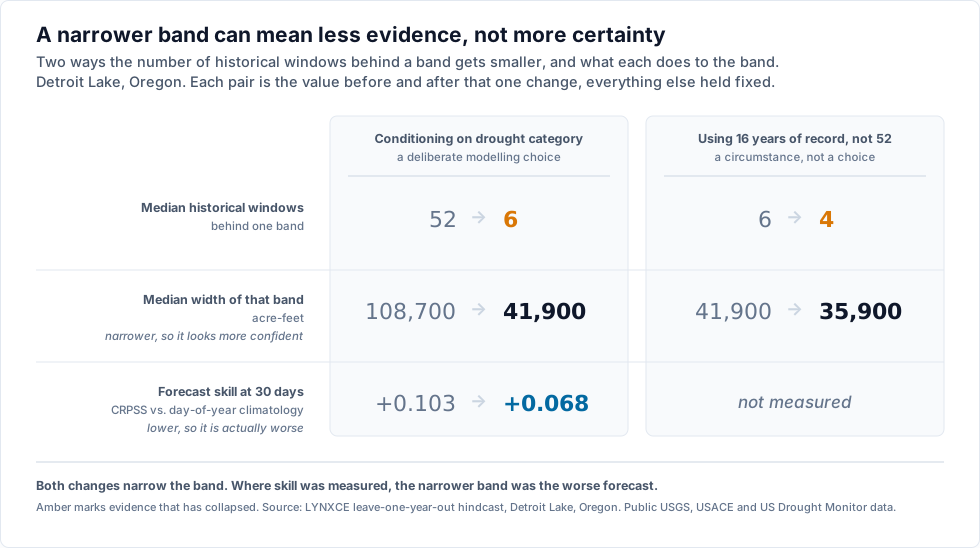
Conditioning splits the pool seven ways, and the median cell falls from 52 historical windows to 6. Drought category does not say enough about the next 10 to 60 days of storage to be worth 46 windows.
Part of this travels to every US site. The Drought Monitor's first map is January 2000, so a drought-conditioned sample tops out at 26 years of anchors however long the pool record runs. Going from 30 years of Detroit data to 52 moved a conditioned band by nothing at all. The covariate is the binding constraint, and the reservoir never was.
Keep that narrow. It says this covariate fails to earn its keep at Detroit, for storage, at these horizons. Detroit is a snow-and-rain Cascade reservoir with almost nothing at the severe end of the drought ladder: D3 on 14 days in 52 years, D4 never. A water-supply reservoir in a dry basin could come out the other way.
Record length works the same way, in the direction that surprises people. Extending Detroit's analogue record from 16 years to the full 52, nothing else changed, widened the median drought-conditioned band by 17 percent, from about 35,900 to about 41,900 acre-feet, and dropped the share of cells resting on two historical windows or fewer from 28.0 percent to 18.5 percent. Truncating back to 16 years narrows that same band by about 14 percent. The short record had simply never seen the extremes the long one contained.
Padding the bands is not the answer. The failure mode that matters is an empty sample quietly returning zero, which travels on through the arithmetic as a perfectly plausible drawdown with nothing downstream able to tell the difference.
Uncertainty band labels might be misleading
Scoring the delivered product, not the underlying idea, turned up a fourth result. This one is about labels.
| Horizon | 10 d | 20 d | 30 d | 40 d | 50 d | 60 d |
|---|---|---|---|---|---|---|
| Observed inside the band | 94.6% | 79.1% | 96.0% | 84.6% | 86.8% | 96.7% |
| Statistic actually used | MIN–MAX | 25th–75th | MIN–MAX | 25th–75th | 25th–75th | MIN–MAX |
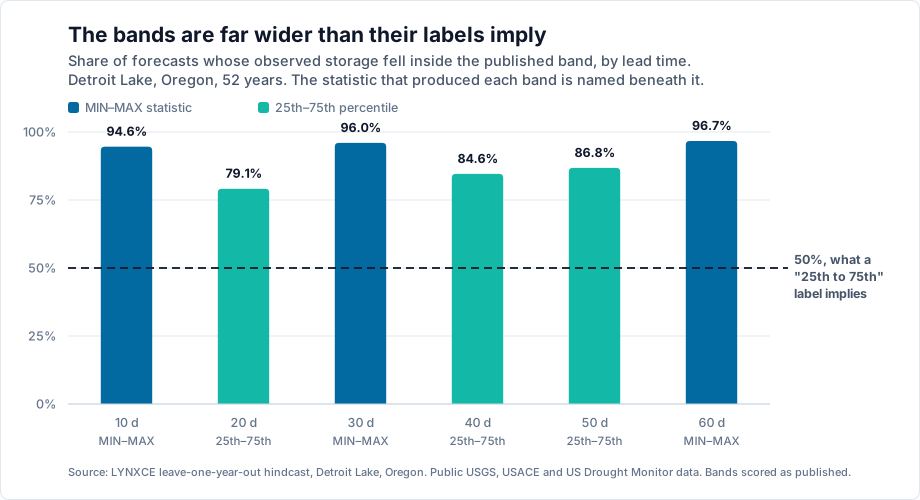
A band presented as a 25th-to-75th-percentile range held the observed value 79 to 87 percent of the time. At the three horizons where the statistic is really the sample minimum and maximum, it held 95 to 97 percent. Two causes: composed bands pair high inflow against low withdrawal, a deliberately conservative design choice, and a MIN–MAX statistic is not a percentile at all.
The band is unlikely to be exceeded, so the label can be misleading. Any deliverable that plots a band should name the statistic behind it on the same axis.
What to require of a reservoir forecast deliverable
The five questions in part one become five requirements in a scope of work.
- Name the benchmark in the same sentence as the skill score. Day-of-year climatology is the sensible default for reservoir storage; persistence flatters any method.
- Fix the hindcast design before the results are seen, and write down the expected answer. Leave-one-year-out has to drop the forecast's own year and the year it lands in, because a December forecast at long lead is scored against a target in the next calendar year.
- Report skill by season, not only in aggregate.
- Measure every conditioning choice instead of assuming it. Only a measurement will say whether a covariate earned what it cost.
- Carry the sample count with every band, and refuse before substituting. Where no historical window matches, return a state instead of a value.
One transition is worth planning around. NOAA's National Water Model has run operationally at v3.1 since August 2026, and the next major version, v4.0, will be the first on the NextGen framework. Reservoirs enter it as boundary conditions rather than coming out as a forecast product. Reservoir storage forecasting stays local work on local records for the planning horizon most firms care about, a point covered further in NextGen and the End of the Monolithic National Water Model.
LYNXCE builds reservoir and water-supply forecasting tools on that basis. Every band carries the number of historical windows behind it and the statistic that produced it, and where no matching window exists the tool says so rather than returning a number that looks like an answer. Where a public reservoir can stand in for the one being modelled, the benchmarked hindcast runs first, on a design fixed in advance. Detroit Lake is that work: public data throughout, scripted end to end, every number pinned by a test so the pipeline cannot change the story quietly.
Teams evaluating a reservoir forecasting tool, or scoping a verification study, can reach us at [email protected].
References
- Pappenberger, F., Ramos, M.H., Cloke, H.L., Wetterhall, F., Alfieri, L., Bogner, K., Mueller, A., and Salamon, P. (2015). "How do I know if my forecasts are better? Using benchmarks in hydrological ensemble prediction." Journal of Hydrology 522: 697-713. DOI: 10.1016/j.jhydrol.2015.01.024.
- Harrigan, S., Prudhomme, C., Parry, S., Smith, K., and Tanguy, M. (2018). "Benchmarking ensemble streamflow prediction skill in the UK." Hydrology and Earth System Sciences 22(3): 2023-2039. DOI: 10.5194/hess-22-2023-2018.
- Chan, W., Facer-Childs, K.A., Tanguy, M., Magee, E., Bulut, B., Stringer, N., Knight, J., and Hannaford, J. (2026). "UK Hydrological Outlook using Historic Weather Analogues." Hydrology and Earth System Sciences 30(4): 905-927. DOI: 10.5194/hess-30-905-2026.
- Arnal, L., Clark, M.P., Pietroniro, A., Vionnet, V., Casson, D.R., Whitfield, P.H., Fortin, V., Wood, A.W., Knoben, W.J.M., Newton, B.W., and Walford, C. (2024). "FROSTBYTE: a reproducible data-driven workflow for probabilistic seasonal streamflow forecasting in snow-fed river basins across North America." Hydrology and Earth System Sciences 28(17): 4127-4155. DOI: 10.5194/hess-28-4127-2024.
- Modi, P.A., Carbone, J.C., Jennings, K.S., Kamen, H., Kasprzyk, J.R., Szafranski, B., Wobus, C.W., and Livneh, B. (2025). "Understanding the relationship between streamflow forecast skill and value across the western US." Hydrology and Earth System Sciences 29(20): 5593-5623. DOI: 10.5194/hess-29-5593-2025.
- Li, B., Hazra, A., McNally, A., Slinski, K., Shukla, S., and Anderson, W. (2026). "Skills in sub-seasonal to seasonal terrestrial water storage forecasting: insights from the FEWS NET land data assimilation system." Hydrology and Earth System Sciences 30(4): 1097-1115. DOI: 10.5194/hess-30-1097-2026.
- Baker, S.A., Wood, A.W., Rajagopalan, B., Prairie, J., Jerla, C., Zagona, E., Butler, R.A., and Smith, R. (2022). "The Colorado River Basin Operational Prediction Testbed: A Framework for Evaluating Streamflow Forecasts and Reservoir Operations." Journal of the American Water Resources Association 58(5): 690-708. DOI: 10.1111/1752-1688.13038.
- Vogel, R.M., and Shallcross, A.L. (1996). "The moving blocks bootstrap versus parametric time series models." Water Resources Research 32(6): 1875-1882. DOI: 10.1029/96WR00928.
- Künsch, H.R. (1989). "The Jackknife and the Bootstrap for General Stationary Observations." The Annals of Statistics 17(3): 1217-1241. DOI: 10.1214/aos/1176347265.
- Day, G.N. (1985). "Extended Streamflow Forecasting Using NWSRFS." Journal of Water Resources Planning and Management 111(2): 157-170. DOI: 10.1061/(ASCE)0733-9496(1985)111:2(157).
- Hersbach, H. (2000). "Decomposition of the Continuous Ranked Probability Score for Ensemble Prediction Systems." Weather and Forecasting 15(5): 559-570. DOI: 10.1175/1520-0434(2000)015<0559:DOTCRP>2.0.CO;2.
- Forbis, J., and Ly, C. (2025). "Application of forecast-informed reservoir operations at US Army Corps of Engineers dams in California." Journal of Flood Risk Management 18(1): e13051. DOI: 10.1111/jfr3.13051.
- World Meteorological Organization (2025). Guidelines on the Verification of Hydrological Forecasts. WMO-No. 1364.
- Ralph, F.M., Hutchinson, A., Anderson, M., Fairbank, T., Forbis, J., Haynes, A., Sweeten, J., Talbot, C., Tyler, J., and White, R. (2023). Prado Dam Forecast Informed Reservoir Operations Final Viability Assessment. Center for Western Weather and Water Extremes, Scripps Institution of Oceanography, UC San Diego.
- U.S. Bureau of Reclamation (2026). Snow Water Supply Forecasting Program FY 2026, Notice of Funding Opportunity R25AS00210.
- NOAA Office of Water Prediction. About National Water Model.
- NOAA National Weather Service (2026). Service Change Notice 26-64, Updated: Upgrade of National Water Model and related post processing system on WCOSS, effective August 18, 2026 (Version 3.1). Issued July 30, 2026.
- U.S. Geological Survey. National Water Information System, monitoring locations 14180500 (Detroit Lake near Detroit, OR), 14181500 (North Santiam River at Niagara, OR), 14178000 (North Santiam River below Boulder Creek near Detroit, OR), and 14179000 (Breitenbush River above French Creek near Detroit, OR).
- U.S. Army Corps of Engineers, Northwestern Division. Dataquery 2.0: reservoir and forebay records, Detroit Dam.
- National Drought Mitigation Center, U.S. Drought Monitor. County statistics API.
Need help with your project?
LYNXCE's engineers and scientists apply this expertise directly to client projects. Free initial consultation.